BelugaCDN Becomes the First CDN with an App for Grafana
- January 11, 2018
- by Admin
Miami, FL – 01/11/2017 – BelugaCDN.com, a provider of affordable high-performance IPv6/IPv4 Content Delivery Network (CDN) services, today announced that it has released its plugin for Grafana. This is the company’s latest step in providing customers tools for managing their CDN data.
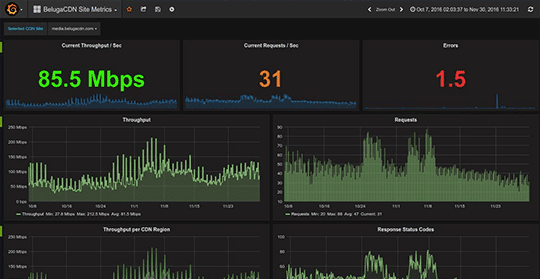
With BelugaCDN’s Grafana plugin, users can create custom dashboards using real-time CDN data, in just a few clicks. Available metrics include (but not limited to) traffic breakdown by CDN region, current requests per second, requests breakdown by HTTP status code, and total errors over time.

“Our goal is to provide customers with tools that will help them make better business decisions,” explains Dmitry Shklovsky, Director, BelugaCDN. “Real-time site metrics help make sense of CDN traffic data and provide valuable insight, while the transparency factor builds trust.”
Those already using Grafana to monitor their origin server performance or other metrics will now be able to monitor CDN performance in the same dashboard, adding simplicity and additional information to their monitoring stack.
“This is the first CDN-focused application for Grafana,” adds Raj Dutt, Grafana Labs CEO. “We’re excited to have BelugaCDN on the list of approved plugins.”
This latest release builds on BelugaCDN’s real-time logs and analytics export API features, providing customers with actionable data and more control over their CDN infrastructure.
About BelugaCDN
Founded in 2015, BelugaCDN is a high-performance IPv4/IPv6 Content Delivery Network. At its core, it consists of a tight group of developers and network engineers with over 15 years experience in the ISP field. With 28 Points of Presence (POPs) throughout the world and 9 SuperPOPs in USA and EU, BelugaCDN excels in fast global content delivery.
For more information, visit https://www.belugacdn.com/ or follow @belugacdn.
Links:
https://grafana.net/plugins/belugacdn-app
Have feedback? Let @belugaCDN know on Twitter


